
數學建模在經濟分析中的關鍵角色
對許多學生而言,數學可能是一門艱難的學科。然而,沒有數學的支持,我們只能模糊地描述變量之間的關係,例如「價格上漲導致需求下降」。但究竟需求減少的幅度是多少?減少的趨勢是線性的還是非線性的?僅憑質性敘述,很難為企業或政府提供精確的決策依據。尤其是面對經濟活動、社會互動、文化風俗等難以量化的人類行為,我們需要通過數學建模(Mathematical Modeling)構建數學工具來描述和分析這些現象。這也正是 STEAM 科目的核心實踐方式之一。
數學模型的例子:以 GDP 量度國家經濟活動
國內生產總值(GDP)是經濟學中用來衡量國家經濟活動的重要指標,其公式為:
GDP = C + I + G + (X - M)
這五個組成部分為什麼不可多也不可少?是否應考慮年度通脹因素?這一指標的誕生源於美國經濟學家西蒙·庫茲涅茨(Simon Kuznets),他於 1934 年首次提出 GDP 的概念,並在 1944 年布列敦森林會議上被正式採納為國家經濟衡量標準。儘管 GDP 無法完全描繪國家的所有經濟活動,卻能「大致」提供量化的數據,為政府根據年度變化調整經濟政策提供依據。
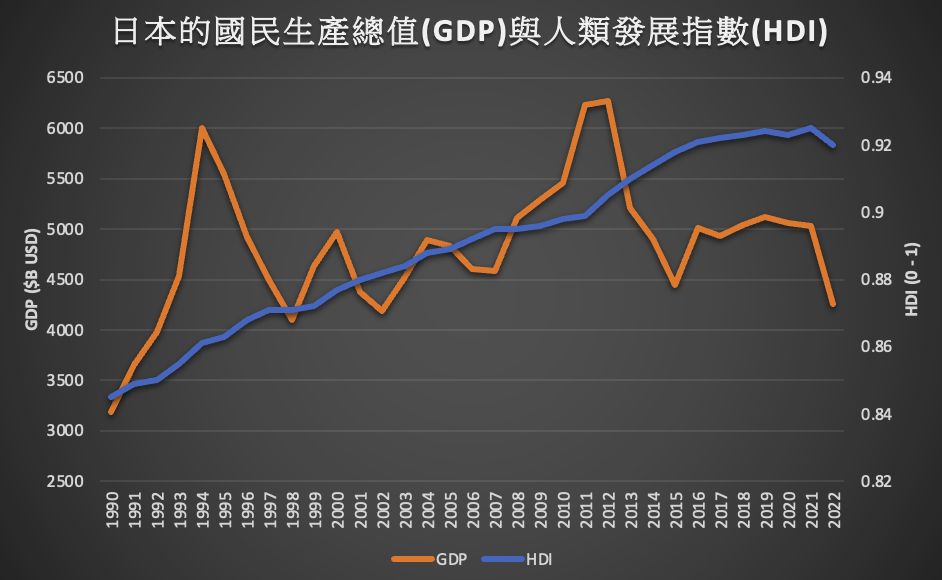
然而,隨著可持續發展目標(SDGs)和環境、社會與公司治理(ESG)的理念日益受到重視,單純依賴 GDP 已難以充分衡量現代社會中的多元需求。現代社會更加關注人文精神與生活品質,一些對經濟有幫助但不涉及市場交易的活動(如家庭勞動與志願服務)無法體現在 GDP 中。因此,經濟學家提出了不少補充指標,例如國民幸福指數(Gross National Happiness, GNH)和人類發展指數(Human Development Index, HDI)等。此外,真實進步指數(Genuine Progress Indicator, GPI)則通過扣除環境損害的成本來更準確反映經濟福祉。這些補充指標的出現反映,數學建模在衡量抽象概念時有其局限性。
選取合適數據的重要性與模型修正
獲取統計數據需要投入大量的人力物力,並且在某些情況下需要專業知識來詮釋。在識字率低或教育水平不足的地區,經濟數據的準確性可能存在偏差。例如在某些農村地區,以物易物的交易方式或不完整的交易記錄可能導致 GDP 中消費(C)部分的數據不準確。在這種情況下,是否可以構建其他數學模型來更準確地描述經濟活動?
過去,中國曾使用「耗電量」、「鐵路貨運量」和「銀行貸款發放量」三個指標來反映經濟狀況。這些指標分別側重於工業生產、經濟運行情況和市場信心,並按以下公式加權計算:
- 4 x(耗電量)+ 0.25 x(鐵路貨運量) + 0.35 x(銀行貸款發放量)
然而,自 2015 年起,該指數逐漸失效,未能反映實際經濟情況。這表明數學模型需要隨著現實條件的變化進行調整,例如修改系數或引入新變量。
數學建模的核心:遞迴與修正
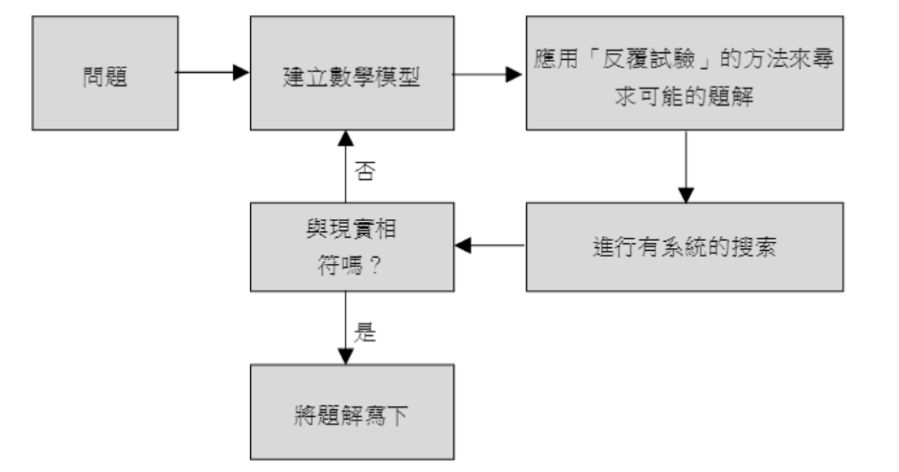
數學建模是一種將數學應用於現實問題並尋求解決方案的思考方式。其遞迴特性(Recursion)與科學探究(Scientific Investigation)和設計思維(Design Thinking)相似:首先提出假設模型,通過實踐驗證並識別模型中的不足,進而重覆進行修正,最終得出最可行的模型。
納斯達克指數被用作美國科技股和互聯網企業股價走勢的指標,間接反映美國新科技公司的表現。然而,在過去一年中,儘管美國經濟環境惡化、企業裁員頻繁,納斯達克指數卻屢創新高。這引發了廣泛討論:納斯達克指數能否真實反映整個資本市場的動態?它是否僅能反映市值最大的幾家企業的表現?如果存在偏差,應如何修正指數計算方式?這些問題本質上都是數學建模的挑戰。
數學模型在商業領域上亦非常重要
數學建模不僅在 STEAM 中廣泛使用,其思考方式亦能在商業活動中體現。從 GDP 到納斯達克指數,再到各種替代性經濟指標,數學建模在經濟學和商業分析中發揮著關鍵作用。它不僅幫助我們更精確地描述複雜現象,還能為決策提供強有力的支持。
The Key Role of Mathematical Modeling in Economic Analysis
For many students, mathematics can be a difficult subject. However, without the support of mathematics, we can only vaguely describe the relationships between variables, such as "an increase in price leads to a decrease in demand". But exactly how much does demand decrease? Is the downward trend linear or non-linear? Relying solely on qualitative descriptions makes it difficult to provide precise decision-making bases for businesses or governments. Especially when facing human behaviors that are difficult to quantify, such as economic activities, social interactions, and cultural customs, we need to construct mathematical tools through mathematical modeling to describe and analyze these phenomena. This is exactly one of the core practical methods of STEAM subjects.
Example of a Mathematical Model: Measuring National Economic Activity with GDP
Gross Domestic Product (GDP) is an important indicator used in economics to measure national economic activity, and its formula is:
GDP = C + I + G + (X - M)
Why are these five components indispensable? Should annual inflation factors be considered? The birth of this indicator originated from American economist Simon Kuznets, who first proposed the concept of GDP in 1934, and it was officially adopted as the standard for measuring national economies at the Bretton Woods Conference in 1944. Although GDP cannot completely depict all economic activities of a country, it can "roughly" provide quantitative data, offering a basis for governments to adjust economic policies according to annual changes.
However, as the concepts of Sustainable Development Goals (SDGs) and Environmental, Social, and Governance (ESG) gain increasing attention, relying solely on GDP is no longer sufficient to fully measure the diverse needs of modern society. Modern society pays more attention to humanistic spirit and quality of life, and some activities that contribute to the economy but do not involve market transactions (such as domestic labor and volunteer services) cannot be reflected in GDP. Therefore, economists have proposed many supplementary indicators, such as the Gross National Happiness (GNH) index and the Human Development Index (HDI). Furthermore, the Genuine Progress Indicator (GPI) more accurately reflects economic well-being by deducting the costs of environmental damage. The emergence of these supplementary indicators reflects that mathematical modeling has its limitations when measuring abstract concepts.
The Importance of Selecting Appropriate Data and Model Modification
Obtaining statistical data requires significant investment of human and material resources, and in some cases, professional knowledge is needed for interpretation. In regions with low literacy rates or insufficient education levels, the accuracy of economic data may be biased. For example, in certain rural areas, barter transactions or incomplete transaction records may lead to inaccurate data for the consumption (C) component in GDP. In such situations, is it possible to construct other mathematical models to describe economic activities more accurately?
In the past, China used three indicators: "electricity consumption", "railway freight volume", and "bank loan disbursements" to reflect its economic condition. These indicators focused on industrial production, economic operations, and market confidence, respectively, and were calculated using the following weighted formula:
- 4 x {electricity consumption} + 0.25 x {railway freight volume} + 0.35 x {bank loan disbursements}
However, since 2015, this index gradually became ineffective and failed to reflect the actual economic situation. This demonstrates that mathematical models need to be adjusted as real-world conditions change, such as by modifying coefficients or introducing new variables.
The Core of Mathematical Modeling: Recursion and Correction
Mathematical modeling is a way of thinking that applies mathematics to real-world problems and seeks solutions. Its recursive nature is similar to Scientific Investigation and Design Thinking: first proposing a hypothetical model, verifying it through practice and identifying its shortcomings, and then repeatedly making corrections to ultimately derive the most viable model.
The Nasdaq index is used as an indicator for the stock price trends of US technology and internet companies, indirectly reflecting the performance of new technology companies in the US. However, over the past year, despite a deteriorating US economic environment and frequent corporate layoffs, the Nasdaq index has repeatedly hit new highs. This has sparked widespread discussion: Can the Nasdaq index truly reflect the dynamics of the entire capital market? Does it merely reflect the performance of a few companies with the largest market capitalizations? If a bias exists, how should the index calculation method be corrected? These questions are essentially the challenges of mathematical modeling.
Mathematical Models are Also Crucial in the Business Sector
Mathematical modeling is not only widely used in STEAM, but its way of thinking can also be reflected in business activities. From GDP to the Nasdaq index, and then to various alternative economic indicators, mathematical modeling plays a critical role in economics and business analysis. It not only helps us describe complex phenomena more precisely but also provides robust support for decision-making.